Hiển thị các bài đăng có nhãn anomalies. Hiển thị tất cả bài đăng

Thứ Hai, 1 tháng 6, 2015

Heat Wave Forecast For Russia Early June 2015


Following heat waves in Alaska and the north of Canada, the Arctic looks set to be hit by heat waves along the north coast of Russia in early June, 2015. The image below shows temperature anomalies at the top end of the scale for a large area of Russia forecast for June 6, 2015.


Meanwhile, the heat wave in India continues. It killed more than 2,100 people, reports Reuters, adding that the heat wave also killed more than 17 million chickens in May. The number of people killed by the heat wave is now approaching the 2,541 people killed by the 1998 heat wave in India, which is listed as the record number of deaths due to extreme temperatures in India by the Emergency Events Database.

Further records listed by the database are the well over 70,000 people killed by the 2003 heat wave in Europe and 55,736 people killed by the 2010 heat wave in Russia alone.

On above temperature forecast (left image, top right), temperatures over a large area of India will be approaching the top end of the scale, i.e. 50°C or 120°F. While such temperatures are not unusual in India around this time of year, the length of the heat wave is extraordinary. The heat wave that is about to hit Russia comes with even higher temperature anomalies. Even though temperatures in Russia are unlikely to reach the peaks that hit India, the anomalies are at the top end of the scale, i.e. 20°C or 36°F.

Below is a forecast for the jet stream as at June 7, 2015.
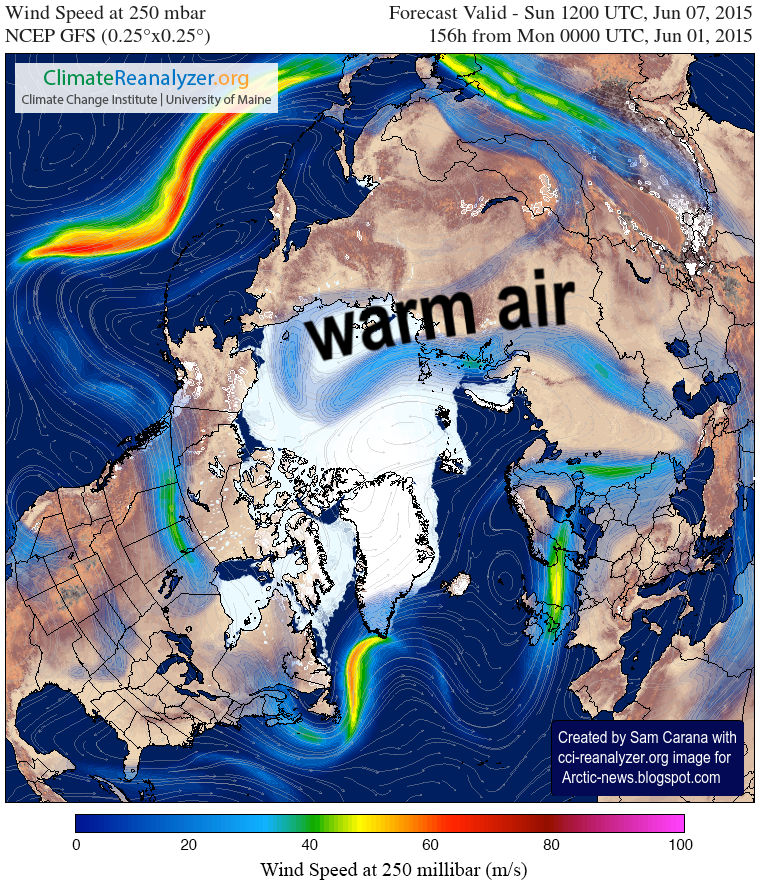
The animation below runs the time of the top image (June 6, 2015, 0900 UTC) to the above image (June 7, 2015, 1200 UTC), showing forecasts of the jet stream moving over the Arctic Ocean, with its meandering shape holding warm air that extends from Russia deep into the Arctic Ocean.


Below is another view of the situation.
Jet stream on June 6, 2015, 0900 UTC, i.e. the date and time that corresponds with the top image.
Clicking on this link will bring you to an animated version that also shows the wind direction, highlighting the speed (I clocked winds of up to 148 km/h, or 92 mph) of the jet stream as it moves warm air from Russia into the Arctic Ocean, sped up by cyclonic wind around Svalbard.

This is the 'open doors' feedback at work, i.e. feedback #4 on the feedbacks page, where accelerated warming in the Arctic causes the jet stream to meander more, which allows warm air to enter the Arctic more easily, in a self-reinforcing spiral that further accelerates warming in the Arctic.

The implications of temperatures that are so much higher than they used to be are huge for the Arctic. These high temperatures are heating up the sea ice from above, while rivers further feed warm water into the Arctic Ocean, heating up the sea ice from below.

Furthermore, such high temperatures set the scene for wildfires that can emit huge amounts of pollutants, among which dust and black carbon that, when settling on the sea ice, can cause large albedo falls.

The image below shows Russian rivers that end up in the Arctic Ocean, while the image also shows sea surface temperature anomalies as high as 8.2°C or 14.76°F (at the green circle, near Svalbard).


The big danger is that the combined impact of these feedbacks will accelerate warming in the Arctic to a point where huge amounts of methane will erupt abruptly from the seafloor of the Arctic Ocean.
The image below shows that methane levels as high as 2566 ppb were recorded on May 31, 2015, while high methane levels are visible over the East Siberian Arctic Shelf.


Below is part of a comment on the situation by Albert Kallio:
As the soils warm up the bacteria in them and the insulating capacities of snow themselves tend to lead snow cover melting faster the warmer the soil it rests on becomes. (Thus the falling snow melts very rapidly on British soil surface if compared to Finland or Siberia where the underlying ground is much colder, even if occasionally the summers have similar or even higher temperatures).

The large snow cover over the mid latitude land masses is a strong negative feedback for the heat intake from the sun if the season 2015 is compared with the season 2012, but the massive sea ice and polar air mass out-transportation equally strongly weakens formation of new sea ice around the North Pole (and along the edges of the Arctic Ocean) as the air above the Arctic Ocean remains warm. The pile up of thin coastal ice also increases vertical upturning of sea water and this could have detrimental effects for the frozen seabed that is storing methane clathrates. The sunlight intake of the sea areas where sea ice has already disappeared corresponds largely with the 2012 season.

The inevitable snow melting around the Arctic Ocean will also transport record volumes of warmed melt water from the south to the Arctic Ocean. The available heat in the Arctic may also be later enhanced by the high sea water temperatures that prevail along the eastern and western coasts of North America, as well as El Nino event increasing temporarily air and sea surface temperatures. This leads to more depressions around Japan and Korea from where the warm air, storms and rains migrate towards Alaska and pull cold air away from Arctic over Russia, while pushing warm air through the Baring Strait area and Alaska to the Arctic Ocean region.

Forecasting seasonal out comes is likely to be increasingly difficult to make due to increasing number of variables in the seasonal melting processes and the resulting lack of historic precedents when the oceans and Arctic has been as warm as today. Thus the interplay of the opposing forces makes increasingly chaotic outcomes, in which the overall trend will always be for less ice and snow at the end of the season. Because of these reasons - including many others not explicitly mentioned here - the overall outcome for the blue ocean, or the ice-free Arctic Ocean, will be inevitable.

Whether the loss of sea ice happens this summer, or next, or one after that, the problem isn't going to go away and more needs to be done to geoengineer to save Arctic ice and wildlife dependent on summer sea ice.
John Davies responds:
Albert Kallio is absolutely right in saying that warmer temperatures are leading to a blue ocean event though the problem remains in which year this will happen. Additionally Methane is being released from the bottom of the ocean leading to increased Methane concentrations and all that means for a destabilising global climate. Frustratingly, the higher temperatures and increasing Methane concentrations are not yet quite sufficient for us to persuade the scientific community and the public that Armageddon is on the way. Hence it is not yet possible to be in a position to persuade the world community of the urgent need for Geo-engineering to save the Arctic and Global climate. However we may reach this situation in the near future and that will be the only time when it might be possible to save the global climate and prevent Armageddon.

The situation is dire and calls for comprehensive and effective action, as discussed at the Climate Plan page.


This image shows Russian rivers that end up in the Arctic Ocean, while it also shows sea surface temperature anomalies...
Posted by Sam Carana on Monday, June 1, 2015

Thứ Bảy, 11 tháng 10, 2014

Climate Change Accelerating

Methane levels as high as 2562 ppb were recorded on October 9, 2014, as illustrated by the image below.

Many grey areas show up in the image where QC (quality control) failed, as it was too hard to read methane levels in the respective area, apparently due to high moisture levels (i.e. snow, rain or water vapor) in the atmosphere.


As above image illustrates, cloud cover is high over the Arctic, while there is also precipatation in the form of snowfall.

In other words, high levels of methane (above 1950 ppb, colored yellow) could be present over a much larger part of the Arctic Ocean, while methane in these grey areas could be even higher than the measured peak level of 2456 ppb.

This appears to be confirmed by persistent high methane levels over vast areas across the Arctic Ocean both in the morning (top part of the image further above) and in the afternoon (bottom part of image) on 9 October 2014.

Methane levels are this high over the Arctic Ocean for the number of reasons, including:
  • The Gulf Stream keeps pushing warm water into the Arctic Ocean.
  • The resulting eruptions of methane from the seafloor of the Arctic Ocean constitute a feedback that accelerates warming in the Arctic. 
  • As the Arctic warms up more rapidly than the rest of Earth, the Arctic's ice and snow cover will decline, further accelerating warming in the Arctic.
  • As the Arctic warms up more rapidly than the rest of Earth, the speed at which jet streams circumnavigates the Northern Hemisphere will weaken, making it meander more, resulting in a greater frequency and intensity of extreme weather events, such as heat waves, droughts and wildfires. 
Here's an example of intense warming. Look at what is currently happening on Greenland.

As the image above right shows, sea surface temperature anomalies as high as +1.89°C hit the North Atlantic (on October 8, 2014). 

Furthermore, high cloud cover over the Arctic (image further above) makes it hard for the heat there to radiate out into space, further contributing to high temperature anomalies.

The image on the right shows high temperature anomalies over Greenland and parts of the Arctic Ocean on October 11, 2014. Note that anomalies are averaged out over the course of the day (and night).

The image below (right) shows anomalies at the top end of the scale hitting large parts of Greenland at a specific time during this day. The left part of the image below shows how this could happen, i.e. jet streams curling around Greenland trapping warm air inflow from the North Atlantic.


As said, as the Arctic warms up more rapidly than the rest of Earth, the speed at which jet streams circumnavigate the Northern Hemisphere will weaken, making the jets meander more and creating patterns that can trap heat (or cold) for a number of days over a given area. Due to the height of its mountains, Greenland is particularly prone to be increasingly hit by heatwaves resulting from such blocking patterns. Warming changes the texture of snow and ice, making it more slushy and darker, which also makes that it absorbs more of the sunlight's heat, further accelerating melting.

As Paul Beckwith warns in an earlier post, melt rates on Greenland have doubled in the last 4 to 5 years, and melt rates on the Antarctica Peninsula have increased even faster. Based on the last several decades, melt rates have had a doubling period of around 7 years or so. If this trend continues, we can expect a sea level rise approaching 7 meters by 2070.

From: More than 2.5 m sea level rise by 2040
These are all indications that the pace of climate change is accelerating in many ways, the most dangerous one being ever larger methane eruptions from the Arctic Ocean's seafloor. As the image below shows, sea surface temperature anomalies are very high in the Arctic Ocean, indicating very high temperatures under the surface.


U.S. Secretary of State John Kerry recently said: “There are now – right now – serious food shortages taking place in places like Central America because regions are battling the worst droughts in decades, not 100-year events in terms of floods, in terms of fires, in terms of droughts – 500-year events, something unheard of in our measurement of weather.” Warning about looming catastrophe, Kerry adds: “Life as you know it on Earth ends. Seven degrees increase Fahrenheit (3.9°C), and we can't sustain crops, water, life under those circumstances.”

The situation is dire and calls for comprehensive and effective action, as discussed at the Climate Plan blog.


Thứ Ba, 26 tháng 8, 2014

Very warm waters are invading the Arctic Ocean

Global mean methane levels as high as 1836 parts per billion were recorded at several altitudes on August 24, 2014. Meanwhile, the Arctic Ocean continues to warm up. As the image below shows, the ocean heat is felt strongly on the Northern Hemisphere.
Very warm waters from the North Pacific and the North Atlantic Oceans are now invading the Arctic Ocean. Never before in human history have these waters been this warm. In the Arctic Ocean, this is causing very high sea surface temperatures, as shown on the image below.

[ click on image to enlarge ]
The very high temperatures threaten to trigger all kinds of feedbacks, as described in the image below.

Feedbacks in the Arctic
The big danger is that, as the seabed warms up, methane will erupt from hydrates in sediments under the Arctic Ocean. The situation is dire and calls for comprehensiev and effective action, as discussed at the Climate Plan blog.


Chủ Nhật, 29 tháng 6, 2014

High temperatures in the Arctic

The NOAA map below shows sea surface temperature anomalies above 8 degrees Celsius in the Arctic Ocean.


These anomalies are very high, considering that it is now June and the melting season has only just begun.

Partly causing these high temperatures in the Arctic Ocean is water flowing into the Arctic Ocean from rivers. As the map below shows, a number of large rivers flowing through Siberia end in the Arctic Ocean.

map from: http://en.wikipedia.org/wiki/File:Rs-map.png
The Naval Research Laboratory image below shows waters with very low salinity levels (top white rectangles) where warm water from rivers in Siberia enters the Arctic Ocean.


Accelerated warming of the Arctic has changed (and is still further changing) the Jet Streams, increasing the occurence of heat waves on the Norhern Hemisphere that cause huge amounts of warm water to flow into the Arctic Ocean. This is illustrated by the animation below.


[ note: animation is a 2 MB file that may take some time to fully load - click on image to enlarge ]
Another spot to watch, indicated on above map with the bottom white rectangle, is where the Mackenzie River flows into the Beaufort Sea. In this area, sea surface temperatures up to ~17°C (63°F) were recorded from June 26 to 28, 2014, as illustrated by the image below.


As the map below shows, similarly high sea surface temperatures were recorded in the Bering Strait.


High temperatures over North America are making the situation worse. On June 28, 2014, temperatures as high as 27°C (81°F) were recorded in the north of Canada and temperatures as high as 23°C (74°F) were recorded in Alaska, as the map below illustrates.

[ click on image to enlarge ]
The 15-hour forecast below, run on June 29, 2014, shows temperatures in the north of North America of up to ~30°C (86°F) in many areas.


As long as the soil is frozen and covered with snow and ice, much of the sunlight is reflected back into space, while much of the sunlight that gets absorbed goes into melting the snow and ice. Once the snow and ice has melted, that energy goes into heating up the soil. The energy required to melt a volume of ice can raise the temperature of the same volume of rock by 150º C.

In Greenland, meltwater percolation is causing latent heat transport into the firn, making it warm up by as much as +5.7°C at midlevel elevations (1400–2500 m), according to a recent study by Polashenski et al.


The situation is particularly dire for the Arctic Ocean, due to the very warm water on the Northern Hemisphere, currently featuring a sea surface temperature anomaly above 1.5º C, as illustrated by above image.

The prospect of an El Niño event striking this year now is 90%, according to predictions by the European Centre for Medium-range Weather Forecasts.

Arctic sea ice volume minimum is typically reached around halfway into September.

This is still months away, and the number of days the Arctic Ocean is covered by sea ice has fallen dramatically over the years, as illustrated by the image on the right, from a recent study by Claire Parkinson.

The danger is that heat will penetrate sediments underneath the Arctic Ocean that contain huge amounts of methane in the form of hydrates and free gas, resulting in huge eruptions of methane from the seafloor of the Arctic ocean, as described at the methane-hydrates blog.

This risk is intolerable and calls for comprehensive and effective action, as discussed at the Climate Plan blog.


Thứ Ba, 3 tháng 6, 2014

Arctic sea ice in steep decline

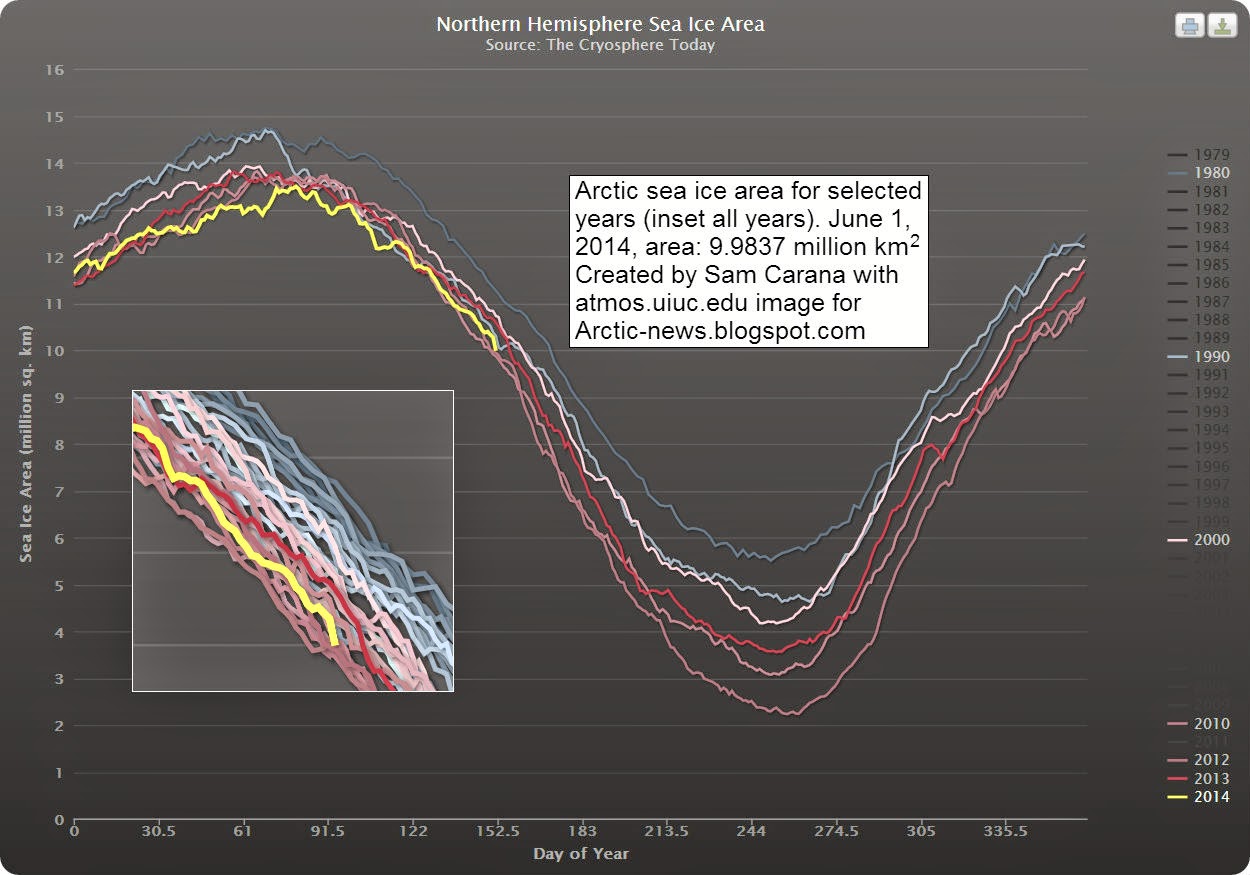
Arctic sea ice area is in steep decline. The yellow line on the image below shows the sea ice area for 2014 up to June 1st, showing an almost vertical fall over the past few days.

[ click on image to enlarge ]
The Naval Research Laboratory image below compares the May 14, 2014, sea ice concentration (left) with the sea ice concentration forecast for June 10, 2014 (run on June 2, 2014, on the right).

[ click on image to enlarge ]
The NOAA image below shows sea surface temperature anomalies on June 3rd, 2014.


The NOAA image shows the huge sea surface temperature anomalies all over the Northern Hemisphere on June 3rd, 2014. Large areas with sea surface temperature anomalies up to 8 degrees Celsius and higher show up in and around the Arctic Ocean

[ click on image to enlarge ]
The image below shows sea surface temperature anomalies up to 1.5 degrees Celsius over the May-June 2014 period, with global average anomalies that hover just above 1 degree Celsius.


Above sea surface anomalies are very high, much higher than historic annual temperature anomalies over land and oceans, as shown on the image below for comparison.


In conclusion, the situation spells bad news for the sea ice, also given the prospect of an El Niño event projected to occur later this year. As discussed in earlier posts, the sea ice is already very thin, and as this image shows, ocean heat is melting the sea ice from beneath, while the sun is warming up the ice from above. At this time of year, insolation in the Arctic is at its highest, as Earth reaches its maximum axial tilt toward the sun of 23° 26'. In fact, insolation during the months June and July is higher in the Arctic than anywhere else on Earth, as discussed at this earlier post.

Feedbacks further accelerate warming in the Arctic, as described in the earlier post Feedbacks in the Arctic. Temperature rises of the water close to the seafloor of the Arctic Ocean is very dangerous, as heat penetrating sediments there could cause hydrate destabilization, resulting in huge amounts of methane entering the atmosphere over the Arctic Ocean.


Thứ Bảy, 15 tháng 2, 2014
Extreme weather strikes around the globe - update

As the weather gets more extreme, disaster strikes around the globe. The Guardian reports three people killed as storms continue to batter southern UK. The Vancouver Sun reports that a U.S. Northeast snowstorm kills 25. And the Sacramento Bee reports Six dead and 1,000 injured in fresh Japan snow storm.

What is the story behind these extreme weather events? The image below tells the story. The Arctic has been much warmer than it used to be, due to numerous feedbacks that accelerate warming in the Arctic. This reduces the temperature differential between the Arctic and lower latitudes, which changes the Jet Stream and Polar Vortex, in turn making the weather at many places ever more extreme.

 earlier forecasts by cci-reanalyzer.org
Above image illustrates the situation, showing an Arctic Ocean that is warmer than the higher latitudes of the Asian and North American continents.

Arctic sea ice has meanwhile reached record lows, as illustrated by the image below.


The situation can be expected to get even worse. The image below shows sea ice extent, as measured by the NSIDC, which is one day ahead compared to above image.


Below, two regular contributors to the Arctic-news blog comment on the situation.


    Paul Beckwith:

Paul Beckwith with sign (arrows highlighted by Sam Carana, from earlier post)
In the video below, Paul Beckwith discusses the above sign and the situation in general.


Dr. Malcolm Light, Earth Scientist, comments:


The volume of water transported by Gulf Stream off the east coast of the United States has increased by three times since the 1940s due to a massive increase in wind drag. This increase in the south westerly wind drag is a result of the continuously increasing pressure difference set up between the continental air mass over North America, heated by fossil - fuel generated carbon dioxide, and the marine air of the Atlantic.

The increased energy entering the Gulf Stream as heat and its associated winds and storm systems are what are now pummeling Great Britain and Europe. This heat is also transported further north by branches of the Gulf Stream into the Arctic Ocean, where it is destabilizing the subsea methane hydrates, releasing increasing volumes of methane into the Arctic atmosphere and causing temperature anomalies this last winter of more than 20 degrees Celsius.

As a consequence of the extremely high Arctic temperatures and pressures, the normal freezing Arctic air has been displaced into Canada and the United States, causing catastrophic blizzards that have never been seen before. When the floating Arctic ice cap melts towards the end of next year, the Arctic Ocean will then become more aggressively heated by the sun and the northern offshoots of the Gulf Stream.

Under these circumstances, the cold Arctic air will be confined over the Greenland ice cap and the Arctic atmosphere will rotate anticlockwise around Greenland, transferring the fast-increasing amounts of its atmospheric methane to Canada and the United States and causing a further increase in the energy of the Gulf Stream.

Therefore the United Kingdom and Europe must brace themselves for even more catastrophic weather systems, widespread flooding and massive wind damage from the start of the last quarter of next year.


Below is a comparison of methane readings for the week from February 9 to 16, 2014, compared to the same period in 2013.


The comparison shows that there is a lot of methane over the Arctic Ocean that wasn't there last year. Furthermore, high methane readings show up where currents move the sea ice out of the Arctic Ocean, in areas such as Baffin Bay. This indicates that methane that is released from the seafloor of the Arctic Ocean appears to be moving underneath the ice and entering the atmopshere where the sea ice is fractured or thin enough to allow the methane to pass through.

Also note that more orange areas show up on the southern hemisphere in 2014, indicating that more methane from the northern hemisphere is now spreading south beyond the equator. This in addition to indications that more methane is rising and building up at higher altitudes, as discussed in an earlier post.

As said before, the situation calls for comprehensive and effective action, as discussed at the Climate Plan blog.


Thứ Hai, 10 tháng 2, 2014

Extreme weather strikes around the globe

  Editorial note: this post has meanwhile been updated as
Extreme weather strikes around the globe update.


As the weather gets more extreme, disaster strikes around the globe.

Here's a snapsnot from today's news. In London, the BBC reports, flooded homes along the River Thames are being evacuated and thousands more are at risk. In Japan, reports Reuters, eleven people died, more than a thousand were injured and tens of thousands lost power when the worst snowstorm in decades hit Tokyo and areas around the Japanese capital before heading north to blanket the tsunami-hit Pacific coast. Many countries in the Middle East were hit by snow. The BBC reports that heavy snow in northern Iran has left around 480,000 homes without power and some towns and villages cut off.

What is causing these extreme weather events? The image below tells the story. While at times it has been cold at many places around the world, when averaged over the past 30 days, temperatures around the globe have actually been several degrees higher than they used to be. The Arctic has been hit hardest, with anomalies as high as 21°C over this 30 day period. This affects the Jet Stream and Polar Vortex, which in turn is making the weather ever more extreme.


The situation is further illustrated by the cci-reanalyzer.org forecasts below.


And while the sea ice didn't look too bad at the start of the year, growth has meanwhile stopped, as illustrated by the image below.


Added below are two videos by Paul Beckwith, further discussing the situation.


Editor's note: Reanalysis of temperature anomaly Jan 12 - Feb 10, 2014.
Meanwhile, I've added another image (above), created with NOAA's reanalysis, which compares temperatures to a larger dataset, and the colors look a lot different, so NOAA may indeed have mixed the colors up somewhat in the initial image, as Albert suggested at the Facebook discussion (click on image below).

Anyway, the point made in the post remains, i.e. that as global warming continues, warming in the Arctic accelerates more rapidly than at lower latitudes, which weakens the polar vortex and jet stream in a self-reinforcing feedback that causes the Arctic to warm up even further compared with lower latitudes.

As said, the situation calls for comprehensive and effective action, as discussed at the Climate Plan blog.


Thứ Ba, 4 tháng 2, 2014

As continental U.S. freezes, Alaska gets record high temperatures

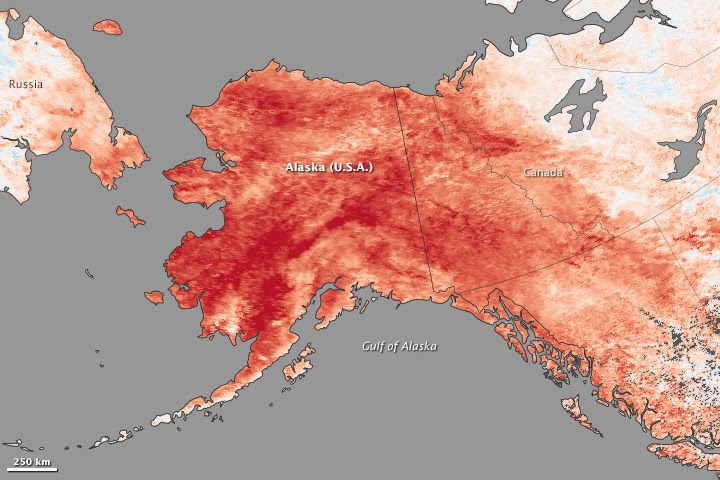
While much of the continental United States endured several cold snaps in January 2014, record-breaking warmth gripped Alaska. Spring-like conditions set rivers rising and avalanches tumbling. NASA Eartobservatory illustrates the above words with the two images below.


Above map depicts land surface temperature anomalies in Alaska for January 23–30, 2014. Based on data from the Moderate Resolution Imaging Spectroradiometer (MODIS) on NASA’s Terra satellite, the map shows how 2014 temperatures compared to the 2001–2010 average for the same week. Areas with warmer than average temperatures are shown in red; near-normal temperatures are white; and areas that were cooler than the base period are blue. Gray indicates oceans or areas where clouds blocked the satellite from collecting usable data.

A persistent ridge of high pressure off the Pacific Coast fueled the warm spell, shunting warm air and rainstorms to Alaska instead of California, where they normally end up. The last half of January was one of the warmest winter periods in Alaska’s history, with temperatures as much as 40°F (22°C) above normal on some days in the central and western portions of the state, according to Weather Underground’s Christopher Bart. The all-time warmest January temperature ever observed in Alaska was tied on January 27 when the temperature peaked at 62°F (16.7°C) at Port Alsworth. Numerous other locations—including Nome, Denali Park Headquarters, Palmer, Homer, Alyseka, Seward, Talkeetna, and Kotzebue—all set January records.

The combination of heat and rain has caused Alaska’s rivers to swell and brighten with sediment, creating satellite views reminiscent of spring and summer runoff. On January 25, 2014, the Aqua satellite collected this image of sediment flowing into the Gulf of Alaska from numerous rivers along the state’s southeastern coast.

All of the heat, moisture, and melting snow has elevated the risk of avalanches. A series of extremely large avalanches in late January sent snow and debris crashing onto the Richardson Highway, blocking the road and cutting the port town of Valdez off from highway access. The avalanches dumped a mound of snow 100 feet (30 meters) tall and up to 1,500 feet (460 meters) long on the highway.


Below are two videos with forecasts for the period from February 4, 2014, to February 11, 2014. The top video shows temperature forecasts and the bottom video shows temperature anomaly forecasts.


Warmer temperatures over the Arctic have resulted in a slowdown of sea ice are growth, as illustrated by the image below (yellow line top left shows 2014 values).


Related posts

- Forecast: America to be hit by temperatures as low as minus 40 degrees
http://arctic-news.blogspot.com/2014/01/forecast-america-to-be-hit-by-temperatures-as-low-as-minus-40-degrees.html

- The Biggest Story of 2013
http://arctic-news.blogspot.com/2013/12/the-biggest-story-of-2013.html

- Polar jet stream appears hugely deformed
http://arctic-news.blogspot.com/2012/12/polar-jet-stream-appears-hugely-deformed.html


Thứ Ba, 28 tháng 1, 2014

Methane Man


At the 2014 State of the Union address, President Obama said that the all-of-the-above energy strategy he announced a few years ago is working, describing natural gas as the bridge fuel that can power our economy.

Just do NOT tell them the monster exists
President Obama said: "Businesses plan to invest almost $100 billion in new factories that use natural gas. I’ll cut red tape to help states get those factories built, and this Congress can help by putting people to work building fueling stations that shift more cars and trucks from foreign oil to American natural gas."

President Obama added: "And when our children’s children look us in the eye and ask if we did all we could to leave them a safer, more stable world, with new sources of energy, I want us to be able to say yes, we did."

Methane levels going through the roof
Sadly, President Obama doesn't. President Obama missed yet another opportunity to articulate a plan to shift to genuinely clean energy, and instead chose to persist supporting all types of energy, in particular natural gas.

As the U.S. shifts to natural gas, more methane is entering the atmosphere. At the same time, methane eruptions from the seafloor of the Arctic Ocean continue to contribute to the temperature rises in the Arctic that are making the weather ever more extreme. The image below shows surface temperature anomalies above 20°C in the Arctic, while anomalies below -20°C feature at lower latitudes.


Thứ Bảy, 11 tháng 1, 2014

Arctic in early January 2014

In early January 2014, Arctic sea ice extent reached levels as low as they were in early January 2013, as illustrated by the image below.


Methane levels over the Arctic remain extremely high. The image below shows methane readings for the period January 1 - 11, 2014, with the inset showing the situation in 2013 for the same period.


Similarly, the image below makes a comparison between methane recorded in 2013 and in 2014 for this period (January 1-11), this time focusing on the Arctic and only showing methane readings of 1950 ppb and higher in yellow.


Below a combination of images by Dr. Leonid Yurganov, also comparing methane levels between early 2013 and 2014. The difference isn't as marked in the image below as in the above image, as the highest value in the image below is 1920+ ppb, whereas the above image highlights levels of 1950+ ppb.


These high methane releases from the seafloor of the Arctic Ocean are contributing to the over 20°C temperature anomalies that have hit parts of the Arctic Ocean recently, as illustrated by the image below.

In conclusion, the Arctic is hit by three kinds of warming, while there are at least 13 feedbacks that further accelerate warming in the Arctic, as described in the post The Biggest Story of 2013.