Hiển thị các bài đăng có nhãn heat. Hiển thị tất cả bài đăng

Thứ Hai, 1 tháng 6, 2015

Heat Wave Forecast For Russia Early June 2015


Following heat waves in Alaska and the north of Canada, the Arctic looks set to be hit by heat waves along the north coast of Russia in early June, 2015. The image below shows temperature anomalies at the top end of the scale for a large area of Russia forecast for June 6, 2015.


Meanwhile, the heat wave in India continues. It killed more than 2,100 people, reports Reuters, adding that the heat wave also killed more than 17 million chickens in May. The number of people killed by the heat wave is now approaching the 2,541 people killed by the 1998 heat wave in India, which is listed as the record number of deaths due to extreme temperatures in India by the Emergency Events Database.

Further records listed by the database are the well over 70,000 people killed by the 2003 heat wave in Europe and 55,736 people killed by the 2010 heat wave in Russia alone.

On above temperature forecast (left image, top right), temperatures over a large area of India will be approaching the top end of the scale, i.e. 50°C or 120°F. While such temperatures are not unusual in India around this time of year, the length of the heat wave is extraordinary. The heat wave that is about to hit Russia comes with even higher temperature anomalies. Even though temperatures in Russia are unlikely to reach the peaks that hit India, the anomalies are at the top end of the scale, i.e. 20°C or 36°F.

Below is a forecast for the jet stream as at June 7, 2015.
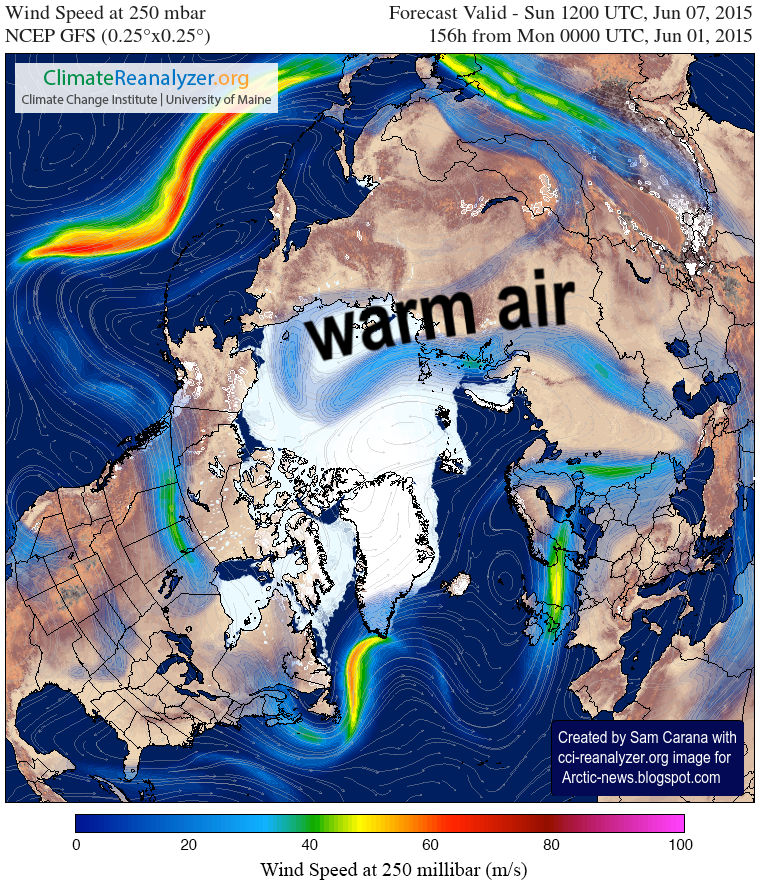
The animation below runs the time of the top image (June 6, 2015, 0900 UTC) to the above image (June 7, 2015, 1200 UTC), showing forecasts of the jet stream moving over the Arctic Ocean, with its meandering shape holding warm air that extends from Russia deep into the Arctic Ocean.


Below is another view of the situation.
Jet stream on June 6, 2015, 0900 UTC, i.e. the date and time that corresponds with the top image.
Clicking on this link will bring you to an animated version that also shows the wind direction, highlighting the speed (I clocked winds of up to 148 km/h, or 92 mph) of the jet stream as it moves warm air from Russia into the Arctic Ocean, sped up by cyclonic wind around Svalbard.

This is the 'open doors' feedback at work, i.e. feedback #4 on the feedbacks page, where accelerated warming in the Arctic causes the jet stream to meander more, which allows warm air to enter the Arctic more easily, in a self-reinforcing spiral that further accelerates warming in the Arctic.

The implications of temperatures that are so much higher than they used to be are huge for the Arctic. These high temperatures are heating up the sea ice from above, while rivers further feed warm water into the Arctic Ocean, heating up the sea ice from below.

Furthermore, such high temperatures set the scene for wildfires that can emit huge amounts of pollutants, among which dust and black carbon that, when settling on the sea ice, can cause large albedo falls.

The image below shows Russian rivers that end up in the Arctic Ocean, while the image also shows sea surface temperature anomalies as high as 8.2°C or 14.76°F (at the green circle, near Svalbard).


The big danger is that the combined impact of these feedbacks will accelerate warming in the Arctic to a point where huge amounts of methane will erupt abruptly from the seafloor of the Arctic Ocean.
The image below shows that methane levels as high as 2566 ppb were recorded on May 31, 2015, while high methane levels are visible over the East Siberian Arctic Shelf.


Below is part of a comment on the situation by Albert Kallio:
As the soils warm up the bacteria in them and the insulating capacities of snow themselves tend to lead snow cover melting faster the warmer the soil it rests on becomes. (Thus the falling snow melts very rapidly on British soil surface if compared to Finland or Siberia where the underlying ground is much colder, even if occasionally the summers have similar or even higher temperatures).

The large snow cover over the mid latitude land masses is a strong negative feedback for the heat intake from the sun if the season 2015 is compared with the season 2012, but the massive sea ice and polar air mass out-transportation equally strongly weakens formation of new sea ice around the North Pole (and along the edges of the Arctic Ocean) as the air above the Arctic Ocean remains warm. The pile up of thin coastal ice also increases vertical upturning of sea water and this could have detrimental effects for the frozen seabed that is storing methane clathrates. The sunlight intake of the sea areas where sea ice has already disappeared corresponds largely with the 2012 season.

The inevitable snow melting around the Arctic Ocean will also transport record volumes of warmed melt water from the south to the Arctic Ocean. The available heat in the Arctic may also be later enhanced by the high sea water temperatures that prevail along the eastern and western coasts of North America, as well as El Nino event increasing temporarily air and sea surface temperatures. This leads to more depressions around Japan and Korea from where the warm air, storms and rains migrate towards Alaska and pull cold air away from Arctic over Russia, while pushing warm air through the Baring Strait area and Alaska to the Arctic Ocean region.

Forecasting seasonal out comes is likely to be increasingly difficult to make due to increasing number of variables in the seasonal melting processes and the resulting lack of historic precedents when the oceans and Arctic has been as warm as today. Thus the interplay of the opposing forces makes increasingly chaotic outcomes, in which the overall trend will always be for less ice and snow at the end of the season. Because of these reasons - including many others not explicitly mentioned here - the overall outcome for the blue ocean, or the ice-free Arctic Ocean, will be inevitable.

Whether the loss of sea ice happens this summer, or next, or one after that, the problem isn't going to go away and more needs to be done to geoengineer to save Arctic ice and wildlife dependent on summer sea ice.
John Davies responds:
Albert Kallio is absolutely right in saying that warmer temperatures are leading to a blue ocean event though the problem remains in which year this will happen. Additionally Methane is being released from the bottom of the ocean leading to increased Methane concentrations and all that means for a destabilising global climate. Frustratingly, the higher temperatures and increasing Methane concentrations are not yet quite sufficient for us to persuade the scientific community and the public that Armageddon is on the way. Hence it is not yet possible to be in a position to persuade the world community of the urgent need for Geo-engineering to save the Arctic and Global climate. However we may reach this situation in the near future and that will be the only time when it might be possible to save the global climate and prevent Armageddon.

The situation is dire and calls for comprehensive and effective action, as discussed at the Climate Plan page.


This image shows Russian rivers that end up in the Arctic Ocean, while it also shows sea surface temperature anomalies...
Posted by Sam Carana on Monday, June 1, 2015

Thứ Sáu, 15 tháng 5, 2015

Mackenzie River Warming

On May 12, 2015, a temperature of 80.1°F (or 26.7°C) was recorded in the north of Canada, at a location just north of latitude 63°N.


High temperatures in such locations are very worrying, for a number of reasons, including:
  • They are examples of heatwaves that can increasingly extend far to the north, all the way into the Arctic Ocean, speeding up warming of the Arctic Ocean seabed and threatening to unleash huge methane eruptions.  
  • They set the scene for wildfires that emit not only greenhouse gases such as carbon dioxide and methane, but also pollutants such as carbon monoxide (that depletes hydroxyl that could otherwise break down methane) and black carbon (that when settling on ice causes it to absorb more sunlight). 
  • They cause warming of the water of rivers that end up in the Arctic Ocean, thus resulting in additional sea ice decline and warming of the Arctic Ocean seabed. 
The image below shows increased sea surface temperature anomalies in the area of the Beaufort Sea where the Mackenzie River is flowing into the Arctic Ocean.


The image below further illustrates the situation, with sea ice thickness (in m) down to zero where the Mackenzie River flows into the Arctic Ocean.


Things look set to get worse. The forecast for May 16, 2015, shows high temperatures extending all the way to the coast where the Mackenzie River flows into the Arctic Ocean.


Updates follow below: 
Alaska is hit by high temperatures as well. The image below shows temperatures as high as 25.3°C (77.54°F) at a location just north of latitude 66°N in Alaska.


Below a forecast for May 23, 2015, showing temperatures in Alaska and neighboring parts of Canada that are 36°F (20°C) higher than they used to be (1979-2000 baseline).


The image below shows that temperatures as high as 30.2°C (86.36°F) are forecast for Alaska for May 23, 2015, along the path of the Yukon River, at a latitude of ~66 degrees North (65.98°N).

Furthermore, temperatures as high as 24.2°C (75.56°F) are forecast for the coast, close to where the Mackenzie River flows into the Arctic Ocean. Off the coast, over the water of the Arctic Ocean, temperatures as high as 8°C (46.4°F) are forecast, for a location just north of latitude 70°N, while temperatures as high as 15°C (59°F) are forecast for a location over the water of the Arctic Ocean closer to land.


As the image below illustrates, the jet stream is forecast to move across Alaska on May 23, 2015, bringing warm air into the atmosphere over the Arctic Ocean. The image gives the jet stream's speed at three locations, i.e. the jet stream is forecast to reach speeds as high as 262 km/h (162.8 mph, bottom green circle) over the Pacific Ocean, 165 km/h (102.5 mph, middle green circle) south of Alaska, and 172 km/h (106.9 mph, top green circle) over the Arctic Ocean.


Looking at salinity is a way to see the impact of rivers. The animation below, created with Naval Research Laboratory images over the period May 16 to 20, 2015 (run on May 18, 2015), shows salinity levels falling where the Mackenzie River flows into the Arctic Ocean.


Salinity works in several ways. Falling salinity will increase the temperature at which the sea ice melts. However, such an increase can only temporarily hold back melting, as illustrated by the combination image below, comparing sea ice thickness between May 7 and May 18, 2015.


Let's have a look at some of the feedbacks that haven't been discussed much in earlier posts. The potential for rivers to contribute to sea ice decline is depicted in the diagram below (feedback #24), i.e. extreme weather causing warming of rivers that flow into the Arctic Ocean. Furthermore, evaporation rates are higher over fresh water surfaces than over saline water surfaces (feedback #26) and the resulting increase in water vapor and clouds contributes to further warming (feedback #25), while rain falling on the sea ice will also cause its albedo to decline. The latter feedback also closes some loops. in that sea ice retreat results in more open water, in turn resulting in more water vapor and clouds.


Another feedback is that, as more sea ice turns into open water, less infrared radiation will be emitted and sent out into space, since open oceans are less efficient than sea ice when it comes to emitting in the far-infrared region of the spectrum (feedback #23). Furthermore, as sea ice declines, the increase in Arctic phytoplankton warms the ocean surface layer through direct biological heating (feedback #22).

For more discussion of these feedbacks, see the feedbacks page. In conclusion, the situation is dire and calls for comprehensive and effective action, as discussed at the Climate Plan page.

Forecast for May 16, 2015, showing high temperatures extending all the way to the coast where the Mackenzie River flows...
Posted by Sam Carana on Friday, May 15, 2015

Thứ Bảy, 18 tháng 4, 2015

The Great Unraveling


The great unraveling of how climate catastrophe is unfolding on land and in the oceans, in the atmosphere and the cryosphere, is becoming more and more clear every month.

March 2015 temperatures were the highest for March in the 136-year period of record. NOAA analysis shows that the average temperature across global land and ocean surface temperatures combined for March 2015 was 0.85°C (1.53°F) higher than the 20th century average of 12.7°C (54.9°F).

Ocean temperature anomalies on the Northern Hemisphere for March 2015 were the highest on record. In many ways, the situation looks set to get worse. For the 12-month period from April to March, data from 1880 contain a trendline that points at a rise of 2 degrees Celsius by the year 2032, as illustrated by the image below.

Click on image to enlarge
The rise in Northern Hemisphere ocean temperatures was especially profound in September and October 2014, when methane started to erupt from the Arctic Ocean seafloor in huge quantities.

The image below shows a polynomial trendline pointing at an October Northern Hemisphere sea surface temperature anomaly rise of 2°C (3.6°F) by 2030, and a rise of more than 5°C (9°F) by 2050, compared to the 20th century average, from an earlier post.
From: Ocean Temperature Rise continues
The images below give an idea of the current sea surface temperature anomalies around North America.


On April 11, 2015, a sea surface temperature of 22.2°C (71.96°F) was recorded off the North
American coast (green circle bottom), a 12.6°C (22.68°F) anomaly (green circle top).


Ocean heat is carried by the Gulf Stream from the North Atlantic into the Arctic Ocean. The huge amounts of energy entering the oceans translate into higher temperatures of the water and of the air over the water, as well as higher waves and stronger winds.

The image below highlights waves and winds, showing that waves as high as 12.06 m (39.57 ft) were recorded off the coast of North America in the path of the Gulf Stream, while winds with speeds as high as 115 km/h (71.46 mph) were recorded in that area on April 17, 2015.


The combination image below illustrates the threat. A sea surface temperature of 8°C (46.4°F, green circle left) was recorded near Svalbard on April 17, 2015, an anomaly of 6.2°C (11.16°F, green circle right).

Click on image to enlarge
A continued rise of ocean temperatures on the Northern Hemisphere threatens to unleash huge eruptions of methane from the seafloor of the Arctic Ocean, further accelerating the temperature rise in the Arctic and escalating into runaway global warming.

Malcolm Light comments: "The Pacific heating must be caused by the southward spreading Arctic methane global warming veil that is able to penetrate through a giant hole in the hydroxyl and ozone layer over the far east and is moving eastwards."

Current methane levels remain extremely high (see this recent post), on track to break the record mean level of 1839 ppb (parts per billion) reached in September 2014.


Above image shows that the highest mean methane levels ranged from 1815 ppb on March 30, 2015, to 1828 ppb on April 17, 2015. The highest peak level during this period was 2483 ppb, reached on April 15, 2015.

The extremely high methane levels are undoubtedly contributing to the high temperatures reached in March, especially at higher latitudes, on top of the dramatic global rise of greenhouse gases in general, as illustrated by above contribution by Peter Carter.


Above image shows that temperature anomalies over much of the Arctic Ocean were at the top end of the scale on April 17, 2015, i.e. 20°C or 36°F.

The image below gives an idea of the temperature differences on April 17, 215. While temperatures over the Sahara in Africa were as high as 32.1°C (89.78°F), temperatures over Greenland were as low as -41°C (-41.8°F). In between, temperatures of 2.8°C (37.04°) were recorded over the waters near Svalbard and of 6.1°C (42.98°F) closer to the coast of Norway.


Such wide temperature differences highlight the importance of looking at peaks, rather than at averages. The year-to-date maximum sea surface temperature anomaly, up to April 18, 2015, gives an idea of the peak anomalies that can be expected as the hot season approaches on the Northern Hemisphere.


Below are details for March 2015.


Temperature anomalies as high as 10.2°C (or 18.3°F) were recorded for March 2015 on Kolguyev Island in the Barents Sea.

A rise in ocean temperatures on the Northern Hemisphere of 2°C (3.6°F) by October 2030 looks set to go hand in hand with a 6°C (10.8°F) rise in Arctic temperatures by 2030, fueling runaway global warming, as illustrated by the image below, from another earlier post.

Without action, similar temperature rises look set to hit the globe at large a dozen years later, accompanied by huge temperature swings that threaten to cause depletion of supply of food and fresh water, as discussed by Guy McPherson in the video below and illustrated by the image further below.

Guy McPherson (left) in discussion with Paul Beckwith (right)

From Methane Levels Early 2015

In conclusion, the situation is dire and calls for comprehensive and effective action, as discussed at the Climate Plan blog.


Sources and Related

- Ocean temperatures, NOAA
http://www.ncdc.noaa.gov/sotc/global/2015/03

- Sea Surface Temperatures, from:
http://earth.nullschool.net
and from:
http://polar.ncep.noaa.gov/sst/ophi

- Kolguyev Island temperature anomaly, from:
http://data.giss.nasa.gov/tmp/gistemp/NMAPS/tmp_GHCN_GISS_ERSST_250km_Anom03_2015_2015_1951_1980/nmaps.txt

- Temperature anomaly April 17, 2015, Climate Reanalyzer
http://cci-reanalyzer.org

- Year-to-date maximum sea surface temperature anomaly April 18, 2015, from:
http://coralreefwatch.noaa.gov/satellite/bleaching5km/index_composites_5km.php

- Methane levels. NOAA IASI MetOp
http://www.ospo.noaa.gov/Products/atmosphere/soundings/iasi

- The Mechanism
http://arctic-news.blogspot.com/2015/02/the-mechanism.html

- Three kinds of warming (temperature trendlines), from: Methane levels Early 2015
http://arctic-news.blogspot.com/2015/03/methane-levels-early-2015.html

- Northern Hemisphere October Ocean Temperature Rise, from:
http://arctic-news.blogspot.com/2014/11/ocean-temperature-rise-continues.html


Ocean temperature anomalies on the Northern Hemisphere for March 2015 were the highest on record. In many ways, the...
Posted by Sam Carana on Saturday, April 18, 2015

Thứ Sáu, 27 tháng 3, 2015

Methane Levels Early 2015


The image below shows highest mean methane readings on one day, i.e. March 10, compared between three years, i.e. 2013, 2014 and 2015, at selected altitudes. The comparison indicates that the increase of methane in the atmosphere is accelerating, especially at higher altitudes.


The table below shows the altitude equivalents in mb (millibar) and feet.

56925 feet44689 feet36850 feet30569 feet25543 feet19819 feet14383 feet8367 feet1916 feet
74 mb147 mb218 mb293 mb367 mb469 mb586 mb742 mb945 mb

This rise in global mean methane levels appears to go hand in hand with much higher peak readings, especially at higher altitudes.


From January 1 to March 20, 2015, methane levels reached levels as high as 2619 ppb (on January 12, 2015), while peak daily levels averaged 2373 parts per billion (ppb). At the start of the year, global mean methane levels typically reach their lowest point, while highest mean levels are typically reached in September. Highest daily global mean methane levels for the period from January 1, 2015, to March 20, 2015, ranged from 1807 ppb (January 6, 2015) to 1827 ppb (March 5, 2015).

Further study of the locations with high methane levels indicates that much of the additional methane appears to originate from releases at higher latitudes of the Northern Hemisphere, in particular from the Arctic Ocean, from where it is over time descending toward the equator (methane will typically move closer to the equator over time as it rises in altitude, as discussed in this earlier post).

The largest source of additional methane appears to be emissions from the seabed of the Arctic Ocean. Annual emissions from hydrates were estimated to amount to 99 Tg annually in a 2014  post (image below).


The image below, based on data from the IPCC and the World Metereological Organization (WMO), with an added observation from a NOAA MetOp satellite image, illustrates the recent rise of methane levels and the threat that methane levels will continue to rise rapidly.


What causes these methane eruptions?

Methane eruptions from the seafloor of the Arctic Ocean appear to be primarily caused by rising ocean heat that is carried by the Gulf Stream into the Arctic Ocean. The image below shows sea surface temperatures of 20.9°C (69.62°F, green circle left) recorded off the coast of North America on March 14, 2015, an anomaly of 12.3°C (36.54°F).

[ click on image to enlarge ]
Furthermore, both methane eruptions from the Arctic Ocean seafloor and demise of the Arctic sea ice and snow cover are feedbacks that can interact and amplify each other in non-linear ways, resulting in rapid and intense temperature rises, as illustrated by the image below.

Diagram of Doom - for more background, see Feedbacks
How high could temperatures rise?

Worryingly, a non-linear trend is also contained in the temperature data that NASA has gathered over the years, as described in an earlier post. A polynomial trendline points at global temperature anomalies of over 4°C by 2060. Even worse, a polynomial trend for the Arctic shows temperature anomalies of over 4°C by 2020, 6°C by 2030 and 15°C by 2050, threatening to cause major feedbacks to kick in, including albedo changes and methane releases that will trigger runaway global warming that looks set to eventually catch up with accelerated warming in the Arctic and result in global temperature anomalies of 16°C by 2052.

[ click on image to enlarge ]
Action

The situation is dire and calls for comprehensive and effective action, as discussed at the Climate Plan blog.


Comparison between three years, i.e. 2013, 2014 and 2015, of highest mean methane readings at selected altitudes on...
Posted by Sam Carana on Friday, March 27, 2015

Thứ Bảy, 28 tháng 2, 2015

The Mechanism

What is the mechanism behind accelerated warming of the Arctic Ocean, huge abrupt methane eruptions from the seafloor of the Arctic Ocean and skyrocketing temperatures?


1. Potential for Methane Release in Arctic

Vast amounts of methane are stored in hydrates under the seafloor of the Arctic Ocean. Furthermore, vast amounts of methane in the form of free gas are contained in sediments under the seafloor of the Arctic Ocean. Thirdly, vast amounts of carbon are frozen in the permafrost and much may enter the atmosphere in the form of methane as the permafrost continues to thaw.

Natalia Shakhova et al. in 2010 estimated the accumulated potential for the East Siberian Arctic Shelf (ESAS) region alone (image on the right) as follows:
- organic carbon in permafrost of about 500 Gt
- about 1000 Gt in hydrate deposits
- about 700 Gt in free gas beneath the gas hydrate stability zone.

In early 2014, Sam Carana estimated annual methane emissions from hydrates and permafrost at 100 Tg (i.e. 0.1 Gt). This methane will contribute to further warming of the air over the Arctic and the North Atlantic, causing further extreme weather events, such as heatwaves and storms along the path of the Gulf Stream from the North Atlantic into the Arctic Ocean, in turn triggering further releases from hydrates at the seafloor of the Arctic Ocean and threatening to escalate into runaway global warming.


Such methane eruptions are caused by warming water of the Arctic Ocean, which in turn is due to emissions by people. Some elements of the mechanism causing methane to erupt from the seafloor are described in more detail below.

2. Ocean Heat
From: Ocean Temperature Rise continues
Above graph, based on NOAA data, shows a polynomial trendline pointing at an October Northern Hemisphere sea surface temperature anomaly rise of more than 5°C (9°F) by 2050, compared to the 20th century average, from an earlier post.

Waters at greater depth are also warming rapidly, as illustrated by the image on the right, from an earlier post, showing a rise in ocean heat up to 2000 m deep that has more than doubled over the past decade. Data from 2005 through to 2014 contain a polynomial trendline that points at a similar rise by 2017, followed by an even steeper rise.

The North Atlantic is warming rapidly, with sea surface temperature anomalies as high as a 12°C (21.6°F) recorded east of North America earlier this year, as illustrated by the image below.

A warmer North Atlantic is a major contributor to the rapidly warming waters of the Arctic Ocean, since the Gulf Stream keeps carrying warmer water into the Arctic Ocean all year long.

A further contributor is a warmer North Pacific.

Further contributions come from the combined impact of numerous feedbacks, in particular changing winds and currents, cryosphere changes and methane releases, as further described below.

From: Watch where the wind blows

3. Feedbacks: Changing Winds and Currents, Cryosphere Changes and Methane

- Changed Winds and Currents

Emissions by people are not only causing temperatures of the atmosphere and oceans to rise, they are also causing winds and ocean currents to change. Such changes can in turn result in heatwaves that are more intense and that persist for prolonged periods. Furthermore, strong northbound winds, combined with strong precipitation and waves can speed up the volume of warm water carried by Gulf Stream into the Arctic Ocean, as discussed in an earlier post

- Arctic Sea Ice

A warming atmosphere, warming oceans and decline of the Arctic snow and ice cover all go hand in hand. The IPCC concluded in AR5 that, for RCP8.5, the Arctic Ocean will likely be nearly ice-free in September before mid-century. Prof. Peter Wadhams warned, back in 2012, that the Arctic Ocean could be virtually ice-free within a few years. An exponential trendline based on sea ice volume observations shows that sea ice looks set to disappear in 2019, while disappearance in 2015 is within the margins of a 5% confidence interval, reflecting natural variability, as discussed at the FAQ page.


- Permafrost

Permafrost decline will cause Arctic temperatures to rise, due to albedo change and due to carbon that is contained in the permafrost and that can be expected to be released in the form of methane or carbon dioxide as the permafrost thaws. The image below pictures permafrost decline as foreseen by the IPCC in AR5. 


Obviously, rapid decline of the sea ice will come with albedo changes that will also make the permafrost decline more strongly than the IPCC foresees, while they will also cause even more extreme weather events. One of the dangers is that huge amounts of warmer water will flow from rivers into the Arctic Ocean, as discussed below.

- Warmer Water From Rivers

More sunlight getting absorbed in the Arctic will accelerate warming of the Arctic Ocean directly, while there will also be warmer water flowing into the Arctic Ocean from rivers in Siberia and North America, fueled by stronger and longer heatwaves, storms and wildfires. 

map from: http://en.wikipedia.org/wiki/File:Rs-map.png
Above map shows that a number of large rivers in Siberia end up in the Arctic Ocean. Another large river is the Mackenzie River, which ends in the Beaufort Sea, north of Alaska, where sea surface temperatures of about 20°C (68°F) were recorded in 2013, as the image below illustrates.


Another area of concern, also marked with a purple oval in the image below, is located in the north of Canada.


More extreme weather events include heat waves, storms, floods and wildfires, all of which can contribute to more rapid warming of the Arctic Ocean.

The combined effect of all the above will be that methane that is now contained in the form of free gas and hydrates in sediments under the Arctic Ocean, can be expected to be increasingly released as the Arctic Ocean warms further.

- Methane 

Of the vast amounts of methane stored in the Arctic, much of it is prone to be released with further temperature rises, as discussed in this earlier post and in this earlier post. Cracks in sediments used to be filled with ice. Warmer water is now melting the ice that used to sit in cracks. This ice has until now acted as a glue, holding the sediment together. Moreover, the ice in the cracks has until now acted as a barrier, a seal, that prevented the methane contained in those sediments from escaping. In a video interview with Nick Breeze, Natalia Shakhova mentions a sample of sediment taken from the ESAS seafloor in 2011 that turned out to be ice-free to a depth of 53 m at water temperatures varying from -0.6˚C to -1.3˚C. Back in 2008, Natalia Shakhova et al. considered release of up to 50 Gt of predicted amount of hydrate storage as highly possible for abrupt release at any time.

The image below, based on data from the IPCC and the World Metereological Organization (WMO), with an added observation from a NOAA MetOp satellite image, illustrates the recent rise of methane levels and the threat that methane levels will continue to rise rapidly.


When looked at from a longer range of years, above image fits in the black square on the image below.


The image below shows exponential rise based on data of East Siberian Arctic Shelf (ESAS) releases alone, as discussed in an earlier post.


Non-linear rise is supported by the fact that methane's lifetime increases as more methane enters the atmosphere. As the image below shows, peak methane levels have been very high recently.


All these feedbacks can interact and amplify each other in non-linear ways, resulting in rapid and intense temperature rises, as illustrated by the image below.

Diagram of Doom - for more background, see Feedbacks

4. Runaway Global Warming

The threat is that such rapid temperature rises will appear at first in hotspots over the Arctic and eventually around the globe, while also resulting in huge temperature swings that could result in depletion of supply of food and fresh water, as further illustrated by the above image, from an earlier post, and the image below, from another earlier post.

Rapidly rising temperatures will cause stronger evaporation of sea water. Since water vapor is one of the strongest greenhouse gases, this can further contribute to the non-linear temperature rises pictured above.

In conclusion, the situation is dire and calls for comprehensive and effective action, as discussed at the Climate Plan blog.