Hiển thị các bài đăng có nhãn sea ice. Hiển thị tất cả bài đăng

Thứ Năm, 28 tháng 5, 2015

Arctic Sea Ice in Uncharted Territory

On May 27, 2015, Arctic sea ice extent was merely 11.973 million square kilometers, a record low for the time of the year since satellite started measurements in 1979.


This fall in sea ice extent follows heat waves in Alaska and the north of Canada, as illustrated by the image below.

Temperature in Alaska on the afternoon of May 23, 2015, when a temperature of 91°F (32.78°C) was recorded in Eagle
High temperatures extended over the Beaufort Sea and Chukchi Sea. The image below shows the difference in sea surface temperatures between May 13, 2015, and May 23, 2015.


The large amounts of meltwater flowing into Beaufort Sea and the Chukchi Sea is illustrated by the image below, showing the difference in sea surface salinity between May 17, 2015, and May 24, 2015.


Sea ice has retreated dramatically in the Chukchi Sea and the Beaufort Sea, and in Baffin Bay, with high sea surface temperature showing up where rivers flow into the Arctic Ocean and where the Gulf Stream carries warm water from the Atlantic Ocean into the Arctic Ocean.

The size-reduced navy.mil animations below show the fall in sea surface salinity (left) and the fall in sea ice thickness (right) in the Beaufort Sea, from May 3, 2015, to June 2, 2015 (run May 27, 2015).

Sea surface salinity Beaufort Sea
Sea ice thickness Beaufort Sea
   
The image below shows sea surface temperature anomalies on May 27, 2015.


For reference, the animation below, from the Naval Research Laboratory, shows sea ice thickness over a 30-day period, including a forecast up to June 4, 2015.


Update: here's an image showing Arctic sea ice extent up to May 28, 2015, highlighting that sea ice extent is now well outside 2 standard deviations.


The situation is dire and calls for comprehensive and effective action as discussed at the Climate Plan.


Arctic Sea Ice in Uncharted Territory Sea ice has retreated dramatically in the Chukchi Sea and the Beaufort Sea, and...
Posted by Sam Carana on Thursday, May 28, 2015

Thứ Năm, 21 tháng 5, 2015

Arctic Sea Ice At Historic Low

On May 20, 2015, Arctic sea ice extent was only 12.425 million square km, a record low for the time of the year since satellite measurements began in 1979.


As the Arctic Sea Ice is at a historic low, Alaska faces temperatures as high as 31°C (87.8°F), as illustrated by the image below.


How is it possible for temperatures to get so high at locations so close to the North Pole?

Typhoon Dolphin
Dr. Michael Ventrice, Operational Scientist at The Weather Channel Professional Division points at two typhoons, Noul and Dolphin, that recently hit the western Pacific Ocean.

These typhoons do have some impact. Importantly, global warming is increasing the strength of cyclones. In other words, a greater impact of cyclones on the jet stream can be expected as a feedback of global warming.

Furthermore, global warming is directly changing the path followed by the North Polar Jet Stream, from a relatively straight path at a latitude of 60°N to a wildly meandering path that at some places merges with the Subtropical Jet Stream and reaching speeds as high as 267 km/h (166 mph) and that at other places moves high into the Arctic and reaches speeds as high as 170 km/h (106 mph).


On above image, part of the jet stream even moves right across the pole. Such changes to the jet stream constitute one out of numerous feedbacks of global warming, as discussed at the feedbacks page. Decline of the snow cover and sea ice in the Arctic is another such feedback.

As discussed in earlier posts, heat waves at high latitudes cause thawing of frozen soil and melting of glaciers and snow cover, This results in large amounts of water draining into rivers that end up in the Arctic Ocean. At the same time, heat waves also raise the temperature of the water in these rivers. The larger amounts of warmer water result in additional sea ice decline and warming of the Arctic Ocean seabed.

Such heat waves also set the scene for wildfires that emit not only greenhouse gases such as carbon dioxide and methane, but also pollutants such as carbon monoxide (that depletes hydroxyl that could otherwise break down methane) and black carbon (that when settling on ice causes it to absorb more sunlight).


Above image shows how much warmer the water in the Arctic Ocean is compared to what it used to be, with high anomalies where rivers flow into the Arctic Ocean and where the Gulf Stream carries warm water from the Atlantic Ocean into the Arctic Ocean.

The situation looks set to get worse, as the frequency and intensity of heat waves in North America and Siberia increases as temperature at high latitudes are rising rapidly. Furthermore, warm water is lining up along the path of the Gulf Stream, with sea surface temperature anomalies as high as 10.3°C (18.54°F) recorded off the coast of North America on May 20, 2015, as illustrated by the image below.

Green circle shows a 10.3°C (18.54°F) sea surface temperature anomaly from daily average (1981-2011)

Meanwhile, a very high methane reading was recorded at Barrow, Alaska (hourly average, in situ measurement), as illustrated by the image below.


The big danger is that the combined impact of these feedbacks will accelerate warming in the Arctic to a point where huge amounts of methane will erupt abruptly from the seafloor of the Arctic Ocean.

The situation is dire and calls for comprehensive and effective action, as discussed at the Climate Plan page.


As the Arctic Sea Ice is at a historic low, Alaska faces temperatures as high as 31°C (87.8°F). From the post: Arctic...
Posted by Sam Carana on Thursday, May 21, 2015

Thứ Sáu, 15 tháng 5, 2015

Mackenzie River Warming

On May 12, 2015, a temperature of 80.1°F (or 26.7°C) was recorded in the north of Canada, at a location just north of latitude 63°N.


High temperatures in such locations are very worrying, for a number of reasons, including:
  • They are examples of heatwaves that can increasingly extend far to the north, all the way into the Arctic Ocean, speeding up warming of the Arctic Ocean seabed and threatening to unleash huge methane eruptions.  
  • They set the scene for wildfires that emit not only greenhouse gases such as carbon dioxide and methane, but also pollutants such as carbon monoxide (that depletes hydroxyl that could otherwise break down methane) and black carbon (that when settling on ice causes it to absorb more sunlight). 
  • They cause warming of the water of rivers that end up in the Arctic Ocean, thus resulting in additional sea ice decline and warming of the Arctic Ocean seabed. 
The image below shows increased sea surface temperature anomalies in the area of the Beaufort Sea where the Mackenzie River is flowing into the Arctic Ocean.


The image below further illustrates the situation, with sea ice thickness (in m) down to zero where the Mackenzie River flows into the Arctic Ocean.


Things look set to get worse. The forecast for May 16, 2015, shows high temperatures extending all the way to the coast where the Mackenzie River flows into the Arctic Ocean.


Updates follow below: 
Alaska is hit by high temperatures as well. The image below shows temperatures as high as 25.3°C (77.54°F) at a location just north of latitude 66°N in Alaska.


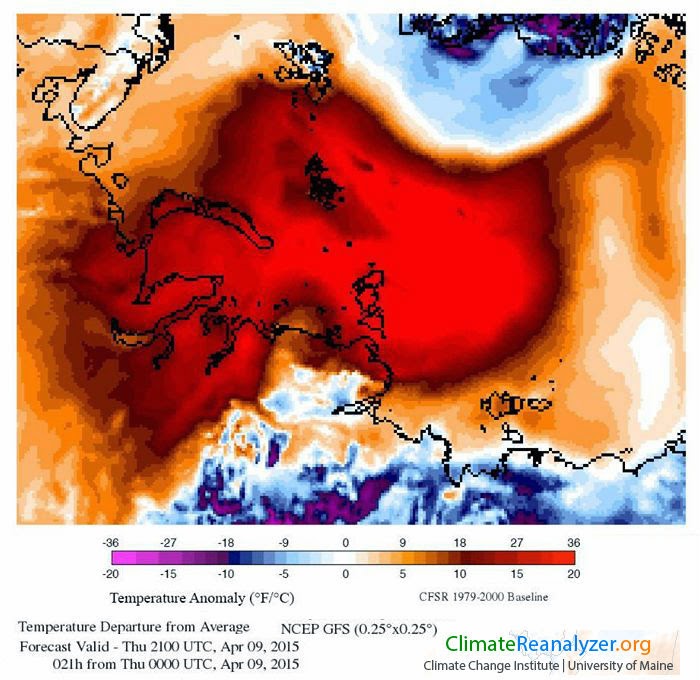
Below a forecast for May 23, 2015, showing temperatures in Alaska and neighboring parts of Canada that are 36°F (20°C) higher than they used to be (1979-2000 baseline).


The image below shows that temperatures as high as 30.2°C (86.36°F) are forecast for Alaska for May 23, 2015, along the path of the Yukon River, at a latitude of ~66 degrees North (65.98°N).

Furthermore, temperatures as high as 24.2°C (75.56°F) are forecast for the coast, close to where the Mackenzie River flows into the Arctic Ocean. Off the coast, over the water of the Arctic Ocean, temperatures as high as 8°C (46.4°F) are forecast, for a location just north of latitude 70°N, while temperatures as high as 15°C (59°F) are forecast for a location over the water of the Arctic Ocean closer to land.


As the image below illustrates, the jet stream is forecast to move across Alaska on May 23, 2015, bringing warm air into the atmosphere over the Arctic Ocean. The image gives the jet stream's speed at three locations, i.e. the jet stream is forecast to reach speeds as high as 262 km/h (162.8 mph, bottom green circle) over the Pacific Ocean, 165 km/h (102.5 mph, middle green circle) south of Alaska, and 172 km/h (106.9 mph, top green circle) over the Arctic Ocean.


Looking at salinity is a way to see the impact of rivers. The animation below, created with Naval Research Laboratory images over the period May 16 to 20, 2015 (run on May 18, 2015), shows salinity levels falling where the Mackenzie River flows into the Arctic Ocean.


Salinity works in several ways. Falling salinity will increase the temperature at which the sea ice melts. However, such an increase can only temporarily hold back melting, as illustrated by the combination image below, comparing sea ice thickness between May 7 and May 18, 2015.


Let's have a look at some of the feedbacks that haven't been discussed much in earlier posts. The potential for rivers to contribute to sea ice decline is depicted in the diagram below (feedback #24), i.e. extreme weather causing warming of rivers that flow into the Arctic Ocean. Furthermore, evaporation rates are higher over fresh water surfaces than over saline water surfaces (feedback #26) and the resulting increase in water vapor and clouds contributes to further warming (feedback #25), while rain falling on the sea ice will also cause its albedo to decline. The latter feedback also closes some loops. in that sea ice retreat results in more open water, in turn resulting in more water vapor and clouds.


Another feedback is that, as more sea ice turns into open water, less infrared radiation will be emitted and sent out into space, since open oceans are less efficient than sea ice when it comes to emitting in the far-infrared region of the spectrum (feedback #23). Furthermore, as sea ice declines, the increase in Arctic phytoplankton warms the ocean surface layer through direct biological heating (feedback #22).

For more discussion of these feedbacks, see the feedbacks page. In conclusion, the situation is dire and calls for comprehensive and effective action, as discussed at the Climate Plan page.

Forecast for May 16, 2015, showing high temperatures extending all the way to the coast where the Mackenzie River flows...
Posted by Sam Carana on Friday, May 15, 2015

Thứ Bảy, 11 tháng 4, 2015

Arctic Sea Ice At Record Low On April 9 2015

On April 9, 2015, Arctic sea ice extent was only 14.051 square km, a record low for the time of the year, as illustrated by the image below.

Temperature anomalies at the top end of the scale (20°C, or 36°F) are hitting the Arctic Ocean in many places, as illustrated by the forecast below, showing an overall anomaly of +3.19°C for the Arctic for April 11, 2015, despite low temperatures over Greenland.


The situation is very worrying, the more so since a huge amount of ocean heat is lining up to be carried into the Arctic Ocean by the Gulf Stream. On April 10, 2015, sea surface temperatures of 24.1°C were recorded off the North American coast (green circle), a +12.5°C anomaly, as the image below shows.


Malcolm Light commentsIn this inverted blowup of the high temperature region you can see the expanded effect of methane hydrate detabilization along the Gakkel Ridge and the high temperatures caused by the onshore methane eruption vents (image below).


The situation is dire and calls for comprehensive and effective action, as discussed at the Climate Plan blog.


On April 9, 2015, Arctic sea ice extent was only 14.051 square km, a record low for the time of the year. From the post ...

Posted by Sam Carana on Saturday, April 11, 2015

Chủ Nhật, 15 tháng 3, 2015

Strong Winds And Waves Batter Arctic Sea Ice

As Earth warms, the intensity of storms is rising across the globe. At least eight people died in Vanuatu, as it was hit by Cyclone Pam. "It hit Port Vila at an incredible 340 kilometres an hour", mentions a recent news report. The left part of the image below shows Cyclone Pam reaching speeds as high as 144 kilometers an hour (89.48 mph, green circle) on March 12, 2015, 1500Z, while three further cyclones feature on the Southern Hemisphere. 


At the same time, on the Northern Hemisphere, winds reached speeds as high as 101 km/h (62.76 mph, bottom green circle), 120 km/h (74.56 mph, middle green circle) and 112 km/h (69.59 mph, top green circle), as shown on the right part of above image.

The image on the right shows winds with speeds as high as 125 km/h (77.67 mph) batter the coast of Greenland on March 13, 2015 (green circle).

The image below shows strong winds moving from the North Atlantic into the Arctic Ocean on March 13, 2015. 


The video below, with cci-reanalyzer.org forecasts for March 13 - 20, 2015, shows strong winds battering the Arctic Ocean at both the Pacific and Atlantic ends.


The combination image below shows winds around Greenland (top) and winds penetrating the Arctic Ocean (bottom).


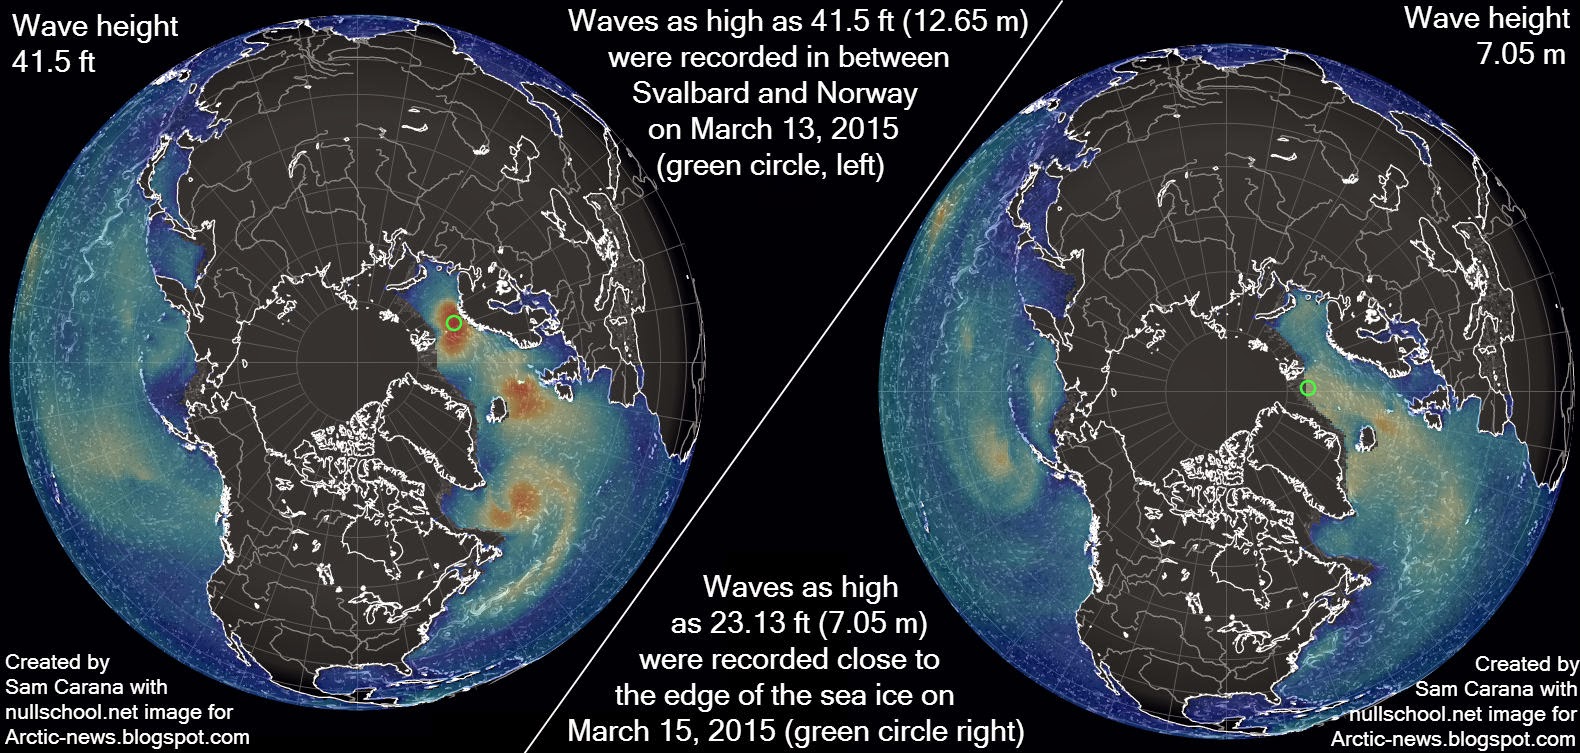
Waves as high as 41.5 ft (12.65 m) were recorded between Svalbard and Norway on March 13, 2015 (green circle on the left part of the image below), while waves as high as 23.13 ft (7.05 m) were recorded close to the edge of the sea ice on March 15, 2015 (green circle on the right part of the image below).


The updated image below shows waves higher than 10 m (33 ft) near Svalbard close to the edge of the sea ice on March 16, 2015 (green circle).


Meanwhile, it more and more looks like the 2015 sea ice extent maximum was reached on February 25, as illustrated by the image below.


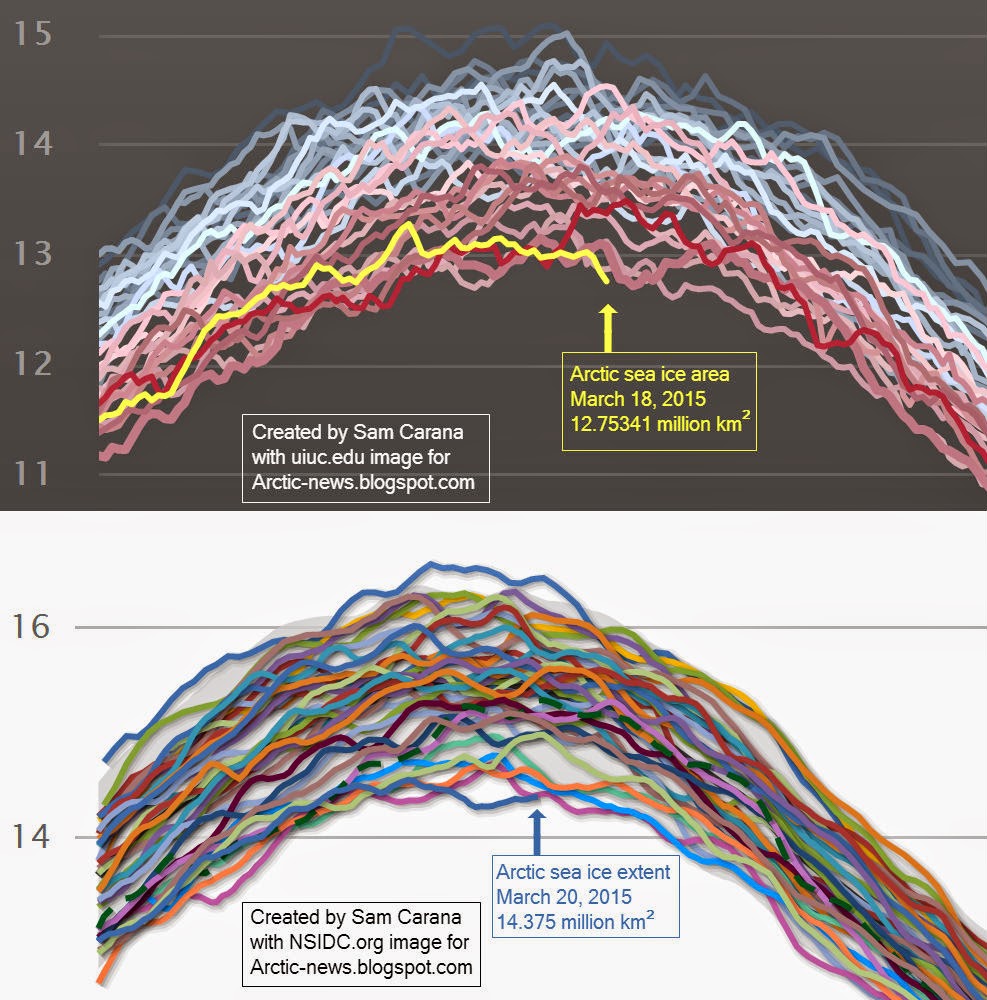
The image below (added later, ed.) shows Arctic sea ice area up to March 18, 2015 (top), and Arctic sea ice extent up to March 20, 2015 (bottom). Briefly, the difference between area and extent could be compared to Swiss cheese. Area is the cheese without the holes, while extent measures the cheese in addition to the holes. For more on this, see this NSIDC FAQ.


Strong winds can cause high waves that can break up the sea ice. At the same time, strong winds can speed up currents that push sea ice out of the Arctic Ocean, while bringing warmer water into the Arctic Ocean, as illustrated by the image below.


The image below shows sea surface temperatures of 20.9°C (69.62°F, green circle left) recorded off the coast of North America on March 14, 2015, an anomaly of 12.3°C or 26.54°F.

[ click on image to enlarge ]
The image below shows sea surface temperature anomalies in the Arctic Ocean on March 15, 2015.


The big danger is that warm water will trigger further releases of methane from the seafloor of the Arctic Ocean. Peak daily methane levels recorded in early 2015 averaged a very high 2370 parts per billion, as illustrated by the image below.


Natalia Shakhova et al. estimate the accumulated methane potential for the Eastern Siberian Arctic Shelf (ESAS, rectangle on image right) alone as follows:
- organic carbon in permafrost of about 500 Gt;
- about 1000 Gt in hydrate deposits; and
- about 700 Gt in free gas beneath the gas hydrate stability zone.

Hydrates can become destabilized by pressure changes that can be caused by earthquakes and resulting shockwaves and landslides, or that can be caused by wild temperature swings.

Hydrates can also become destabilized by a small temperature rise that can be caused by influx of warmer water from outside the Arctic Ocean or by warm surface water being mixed down by storms.

Waters in the ESAS are quite shallow, averaging less than 50 m depth over its 2x10ˆ6 km2 area, while methane hydrates in the ESAS can exist at depths as shallow as 20 m.

Where heat is able to penetrate the sediment along cracks, some hydrate destabilization can occur, which in turn can trigger larger destabilization, as methane escaping from a hydrate expands to 160 times its earlier volume; this explosive expansion can cause further destabilization of sediments containing methane in the form of hydrates and free gas.

The situation is dire and calls for comprehensive and effective action, as discussed at the Climate Plan blog.


Thứ Hai, 9 tháng 3, 2015

September 2015 without Arctic Sea Ice?

The image below shows that Arctic sea ice extent, on March 8, 2015, was merely 14.263 square km.


What would happen if the Arctic sea ice kept falling to, say, under 11 million square km by end April and then followed a trajectory similar to 2012 for the next four months? As the animation below shows, such a scenario could wipe out all Arctic sea ice for more than a month from September 1st, 2015.

The following image is a contribution by Albert Kallio.

Sea ice thickness image, Naval Reserach Laboratory
Albert Kallio comments: "The latest sea ice thickness measurement (9th March 2015) for the US Navy submarines shows that the thick and rigid multiyear sea ice congestion has cleared from the Fram Strait between Greenland and the Svalbard Archipelago. That means sea ice is weak; new ice with saline residues and pack ice is made of numerous thin sea ice slabs that have been compressed to thick piles, rather than fewer thick slabs of multiyear sea ice. That means: more sea ice surface area is exposed to sea water and the heat within it. As a result, sea ice is likely melt even faster once it escapes from the Fram Strait. The wave penetration is also stronger within soft and highly fragmented seasonal ice packs. So, the sea ice is now primed for faster transport out of the Arctic Ocean."

So, what would happen if the sea ice was wiped out like that?

Sunlight that previously went into melting the sea ice, as well as sunlight that was previously reflected back into space by sea ice, would be absorbed by the Arctic Ocean instead. In other words, we can expect massive warming. In an earlier post, Prof. Peter Wadhams warned that warming due to Arctic snow and ice loss may well exceed 2 W per square m, i.e. it could more than double the net warming causing by all emissions by all people of the world.

Professor Peter Wadhams on albedo changes in the Arctic
The resulting temperature rise is likely to start wildfires all over the Northern Hemisphere, which would not only send huge amounts of greenhouse gases and soot into the air, but could also threaten entire cities and cause much of the grid to stop functioning. In 2007, a main power line burnt in Australia causing power outages for many homes and traffic lights in Melbourne. Many power plants require extensive water cooling, which can come under threat during intense heatwaves, as happened in France in 2009. Such events may be dwarfed by future heatwaves. Fuel is often transported by rail to power plants, and the railway tracks could bend during heatwaves. The health threat posed by heatwaves, wildfires and soot may result in critical employee loss at power plants.

As a result, electricity supply could stutter, and much industrial activity may stop, while there may be lots of traffic problems, etc. This is only one of the problems, though, as discussed in the 2007 post Ten Dangers of Global Warming. Food supply will come under threat due to crop loss and reduced supply of food to shops, made worse by traffic problems. As discussed back in 2011, much of the soot from firestorms in Siberia could settle on the ice in the Himalaya Tibetan plateau, melting the glaciers there and causing short-term flooding followed by rapid decrease of the flow of ten of Asia’s largest river systems that originate there, with more than a billion people’s livelihoods depending on the continued flow of this water.

Less industrial activity will not cause an immediate fall of tenmperatures, though. Instead, it would make that the aerosols that are currently sent up in the air by such activities and that are currently masking the full wrath of global warming, will fall out of the air in a matter of weeks. Until now, about half of the global temperature rise is suppressed by such aerosols. Stopping aerosols release overnight could make temperatures rise abruptly by 1.2°C (2.16°F) in a matter of weeks.


Methane eruptions from the seafloor of the Arctic Ocean typically start becoming huge around the end of October.

Conclusion from a paper presented at the 2008 EGU conference, on background
of a frame from a video interview by Nick Breeze with Natalia Shakhova.

Further warming of the Arctic Ocean could cause methane to erupt from the seafloor of the Arctic Ocean in quantities that could quickly double and tripple the amount of methane in the atmosphere.

The combined impact of such feedbacks could wipe out crops, deplete water supplies and make a huge number of species go extinct very quickly, including human beings.

In conclusion, the situation is dire and calls for comprehensive and effective action, as discussed at the Climate Plan blog.